Investors one-year losses continue as Cromwell European Real Estate Investment Trust (SGX:CWBU) dips a further 9.8% this week, earnings continue to decline
It’s easy to match the overall market return by buying an index fund. But if you buy individual stocks, you can do both better or worse than that. That downside risk was realized by Cromwell European Real Estate Investment Trust (SGX:CWBU) shareholders over the last year, as the share price declined 39%. That’s well below the market decline of 4.9%. Notably, shareholders had a tough run over the longer term, too, with a drop of 38% in the last three years. Even worse, it’s down 22% in about a month, which isn’t fun at all.
With the stock having lost 9.8% in the past week, it’s worth taking a look at business performance and seeing if there’s any red flags.
See our latest analysis for Cromwell European Real Estate Investment Trust
In his essay The Superinvestors of Graham-and-Doddsville Warren Buffett described how share prices do not always rationally reflect the value of a business. One flawed but reasonable way to assess how sentiment around a company has changed is to compare the earnings per share (EPS) with the share price.
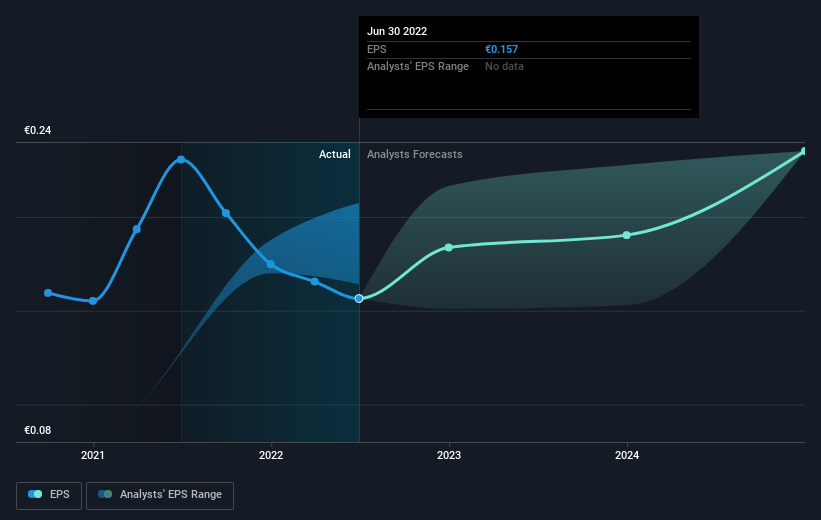
Unfortunately Cromwell European Real Estate Investment Trust reported an EPS drop of 32% for the last year. We note that the 39% share price drop is very close to the EPS drop. Given the lower EPS we might have expected investors to lose confidence in the stock, but that doesn’t seem to have happened. Rather, the share price has approximately tracked EPS growth.
The image below shows how EPS has tracked over time (if you click on the image you can see greater detail).
SGX:CWBU Earnings Per Share Growth October 18th 2022
Before buying or selling a stock, we always recommend a close examination of historic growth trends, available here.
What About Dividends?
It is important to consider the total shareholder return, as well as the share price return, for any given stock. The TSR incorporates the value of any spin-offs or discounted capital raisings, along with any dividends, based on the assumption that the dividends are reinvested. So for companies that pay a generous dividend, the TSR is often a lot higher than the share price return. As it happens, Cromwell European Real Estate Investment Trust’s TSR for the last 1 year was -34%, which exceeds the share price return mentioned earlier. And there’s no prize for guessing that the dividend payments largely explain the divergence!
A Different Perspective
The last twelve months weren’t great for Cromwell European Real Estate Investment Trust shares, which performed worse than the market, costing holders 34%, including dividends. Meanwhile, the broader market slid about 4.9%, likely weighing on the stock. The three-year loss of 7% per year isn’t as bad as the last twelve months, suggesting that the company has not been able to convince the market it has solved its problems. Although Baron Rothschild famously said to “buy when there’s blood in the streets, even if the blood is your own”, he also focuses on high quality stocks with solid prospects. While it is well worth considering the different impacts that market conditions can have on the share price, there are other factors that are even more important. For instance, we’ve identified 3 warning signs for Cromwell European Real Estate Investment Trust (1 makes us a bit uncomfortable) that you should be aware of.
But note: Cromwell European Real Estate Investment Trust may not be the best stock to buy. So take a peek at this free list of interesting companies with past earnings growth (and further growth forecast).
Please note, the market returns quoted in this article reflect the market weighted average returns of stocks that currently trade on SG exchanges.
Valuation is complex, but we’re helping make it simple.
Find out whether Cromwell European Real Estate Investment Trust is potentially over or undervalued by checking out our comprehensive analysis, which includes fair value estimates, risks and warnings, dividends, insider transactions and financial health.
View the Free Analysis
Have feedback on this article? Concerned about the content? get in touch with us directly. Alternatively, email editorial-team (at) simplywallst.com.
This article by Simply Wall St is general in nature. We provide commentary based on historical data and analyst forecasts only using an unbiased methodology and our articles are not intended to be financial advice. It does not constitute a recommendation to buy or sell any stock, and does not take account of your objectives, or your financial situation. We aim to bring you long-term focused analysis driven by fundamental data. Note that our analysis may not factor in the latest price-sensitive company announcements or qualitative material. Simply Wall St has no position in any stocks mentioned.